Essay
A Knowledge Graph Knows What Exists. An Architecture Graph Knows How to Move.
Knowledge graphs cut the cost of reading a codebase. Architecture graphs teach agents how to move through a system, and an organization, with humans owning every decision.
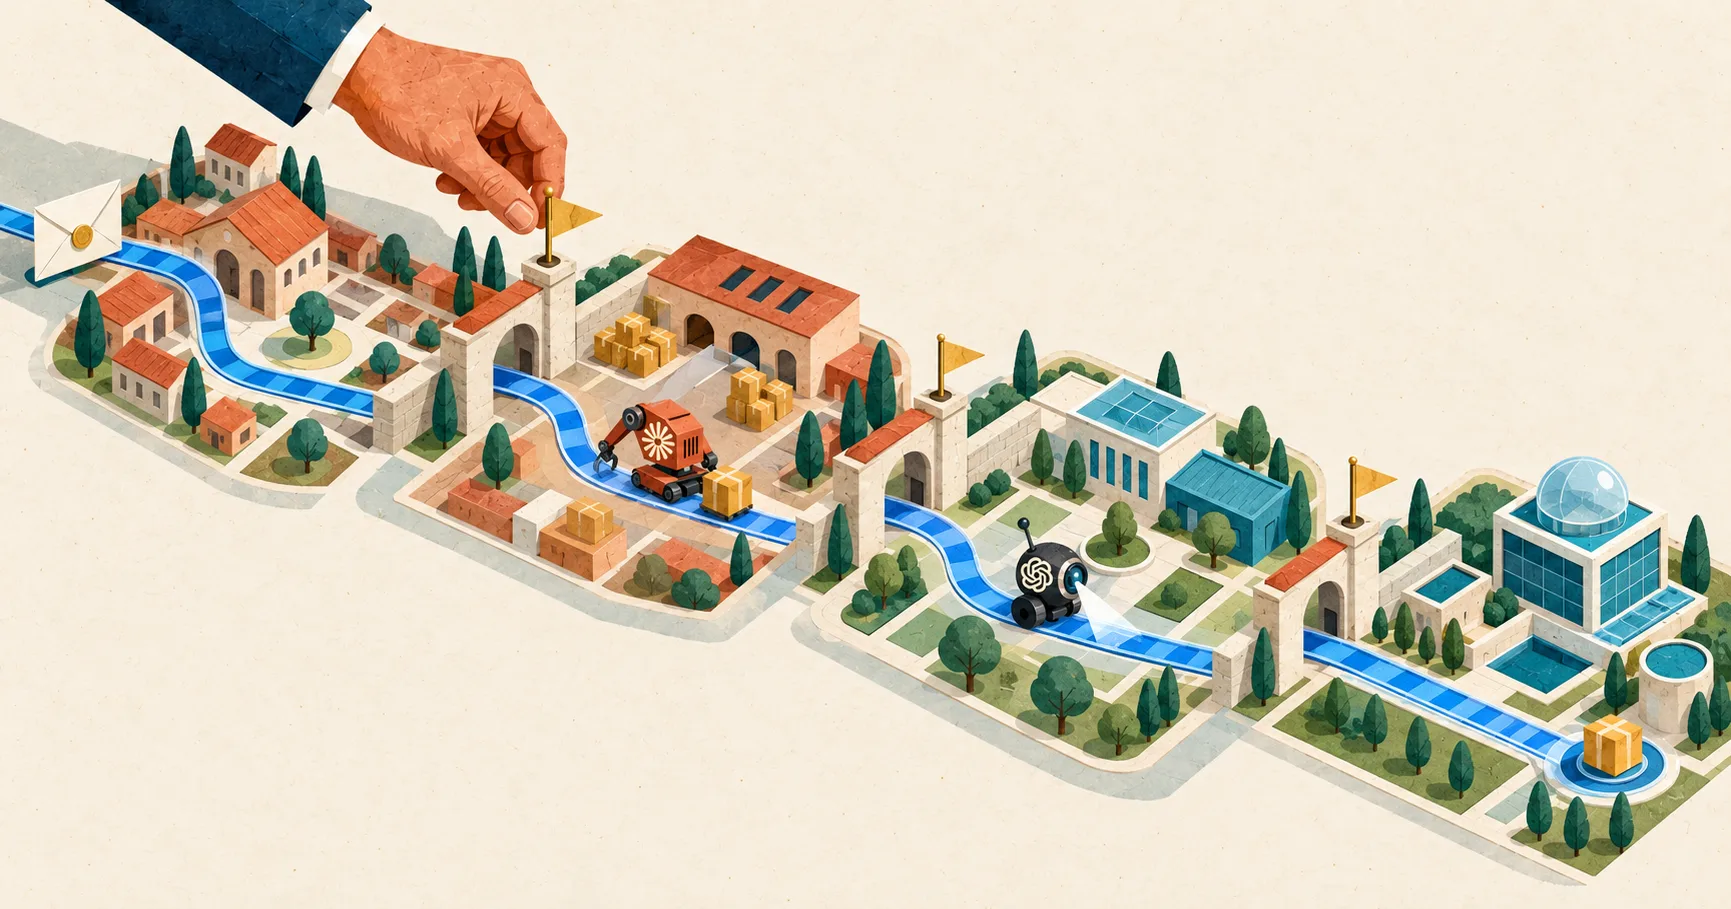
Working with graphs has proven to be one of the most powerful ways to get real value out of AI agents. There are many graph solutions that improve an agent's context before it has to read the whole codebase again, and again. Graphify is one of them. It turns an entire codebase into a knowledge graph that an agent can query instead of re-reading files, and its authors report up to 71.5 times fewer tokens per query on their benchmark corpus.
But there is a limit. Looking only at the code does not give you the full picture of a system. You also need the evidence, a way to interact with the graph, and a human in the loop.
A knowledge graph answers the question: what is in the system? Graph engineering answers a different one: how should an agent move through the system? And, more importantly: how should it move in line with the organization's objectives?
That difference is what my journey with graphs has been teaching me.
Two graphs that are easy to confuse
A recent episode of Greg Isenberg's podcast on graph engineering put the distinction clearly. A knowledge graph maps how information connects: customers, companies, products, teams, and the relationships between them. An agent graph maps how work moves: who plans, who researches, who challenges the result, who merges it, and where a human approves.
They solve different problems. You reach for a knowledge graph when retrieval keeps returning the paragraph that merely looks closest, and you need relationships an agent can reason across. You reach for an agent graph when a task has steps, checks, and handoffs, and you need the agent to take them in the right order.
In practice, I needed both, connected to the same system. That is what I mean by an architecture graph:
| Knowledge graph | Agent graph | Architecture graph | |
|---|---|---|---|
| Question it answers | How does information connect? | How should work move? | How should work move through our system, the way we decide? |
| What it maps | Entities and relationships | Roles, steps, and handoffs | Our main processes, each step tied to the code and evidence behind it |
| Reach for it when | Retrieval misses the relationships | A task has steps, checks, and handoffs | Any change, whether a feature, a bug, or an incident, that crosses systems and owners |
| Who decides | The agent reads | A human approves at the end | Humans own the processes and every gate along the way |
A knowledge graph like Graphify tells the agent what is in the codebase. An agent graph tells it how to work. The architecture graph adds the part neither has on its own: the organization. Which process a request belongs to, who owns it, what evidence counts, and which decisions stay human.
From small pieces to the whole system
I started by automating smaller pieces of the big picture. First came API integrations: implementation, validation, unit tests, integration across multiple systems, and the final end-to-end test a human must run to confirm the output delivers the expected quality. That was the subject of my first article in this series.
Then I moved on to graphs for automated migrations, from a drag-and-drop workflow tool to typed tasks on a cloud platform. That was the second.
Last week I thought I could take this to the next level. I wanted a lightweight UI that gives my team an overview of our main processes across the whole system. At the same time, it should let agents traverse the same graph, so they can use this abstraction to make decisions about any kind of change: a bug fix, an incident, or a new feature.
Each main process is a flow, and each step in the flow points at the code and the evidence behind it. The team reads the same map the agents walk.
Evidence, not code reading
The most impressive part is how much this increases productivity. We rarely start from the code anymore. We generate and validate code based on evidence in the data.
Once several agents have finished a feature or fixed a bug, we as humans test it directly. We call the voice agent, or chat with the chat service, and simulate how a customer would interact with the system. If the system fails, that is new evidence that the implementation is not complete, and I iterate again. I give that feedback to the graph.
The interaction between Codex and Claude is what makes this robust. Sometimes Codex corrects Claude up to ten times in a loop. I see the issues, and my expertise lets me see what went wrong, but I do not need to go into every detail.
What I do verify myself is security, data compliance, and data protection. Those rules are already written into the agents' instructions, but they are my area of responsibility. That is my ownership. Agents are tools, and tools must be used responsibly.
The graph learns the organization
The more I evolve the graphs, the more capable the agents become. Not because I suddenly switched to a more powerful model, but because the system starts to understand more than code: how our organization works, how we make decisions, and how we interact with customers and partners.
So today the agents can read my email, understand a customer request, triage it, create a ticket, and assign it to me or to someone on my team. They then implement it based on evidence and on the context of our whole technical architecture, and raise a pull request, which I review and validate.
This is the moment an organization starts becoming AI-native. And the best part is still to come.
The click
The most powerful moment came this week, when I presented this to one of my partners. He has also been building automated systems for other parts of the company, such as marketing and customer success. It finally clicked for him too: we can bring graph engineering to the whole organization.
The first step, of course, is documenting all our processes: marketing, sales, finance, and tech operations. That way we, as humans, own the processes and the organization's decision making. Agents then become the operators across the graphs, delivering value to our customers.
So the next step is to bring graph engineering to more parts of the company. I am looking forward to sharing more about it in the next articles.
The video below follows one customer request through the graph. The request arrives by email, and an agent triages it on the architecture graph to decide which process it touches: Customer Intake, Booking & Service, User Onboarding, or Operations & Platform. The ticket is assigned to the person who owns that process. Claude builds the fix with the context of the whole architecture, Codex reviews it independently, and a pull request is raised. Then the human gates take over. When the agent tries to merge on its own, it is blocked until a person has reviewed security, data compliance, and data protection. After approval, a human tests the change the way a customer would, by calling the voice agent or chatting with it. In the video, that first test fails. The failure becomes new evidence, the agents iterate, and only when review and test both pass is the change merged.
Agents operate across the graph. Humans own the decisions.
Sources
- John Torres, “The Model Wasn’t the Breakthrough. The Graph Was.” — the graph-engineering foundation of this series.
- John Torres, “Two Models Agreed. Both Were Wrong: An Agentic-Graph Driven Migration” — the migration graph and its human gates.
- Greg Isenberg, “Why Graph Engineering will 10x your Claude/Codex” — the knowledge graph vs. agent graph distinction (from about 4:00).
- Graphify — knowledge graphs of codebases for AI agents; token figures are the project’s own benchmark.